
The Science of Performance Curiosity
- Aug 5, 2025
- 7 min read
Performance curiosity is the science of understanding, observing and improving performance in any operation. The increased amount of data alone in customer facing operations will not drive performance without curiosity into what is occurring and why. This paper explores ways to interpret the data and observe the root causes that drive performance so improvement can occur.
The statistics are just the start of the story
There is an increasing amount of data and information about performance in most businesses but having more data doesn’t always mean organisations and individuals have got better at improving performance. The volume of available data has increased through tools like data lakes and data warehouses, and it’s often become more accessible through presentation software like Power BI. All this data makes it easier to measure performance at all levels. However, this paper will argue that measurement is just the starting point in improving performance, which is the real goal. Visibility of performance is certainly a great starting point but to change performance needs what we call “performance curiosity”.
Managers of people or process need to be interested in why this level of performance is occurring. They need to be curious if they are going to change performance. If managers try to improve performance with summary performance information alone, we find it doesn’t work and can be perceived negatively by those being managed. It is like a coach saying to their team “play better” when they are losing a game. If a sales manager, for example, just tells his team “Our sales results are down, so sell more” it is unlikely to be a sustainable solution and may produce negative outcomes like selling inappropriately. There is also increasing industrial relations sensitivity in how people are managed relative to their performance and “just do better” is therefore an inappropriate technique. A performance curious manager will, in contrast, understand what is producing this current level of performance, so they know what they need to do to help their people improve.
“Performance Curiosity” is a process that unlocks the potential to change performance at any level. It can be applied to a whole process like sales, to a channel like branches or to the performance of individuals in teams. This paper will suggest that there are some common mechanisms to Performance Curiosity that apply across all these levels and will cover:
1. Getting the right information to understand performance at the right level of detail
2. The need for observation to supplement information
3. The need to understand the best way to execute a process once the performance causes are understood. We will explore each in turn.
The right information to understand performance
Most organisations have dashboards illustrating “performance” at many levels. However, this “data democratisation” has commonly meant it is up to each manager to create their own views of this data. Often this means the default views only show “point in time” data of a particular day or period where we would recommend “trend” views to really understand performance. (See our paper “Have dashboards done their dash”). How information is gathered and represented is the first step in performance curiosity. An effective manager will not look at a single period’s performance in isolation but will understand trends and the relationship between different types of information. In the example below, the trend in use of two channels over a year for insurance claims tells a story about which channel is proving effective:
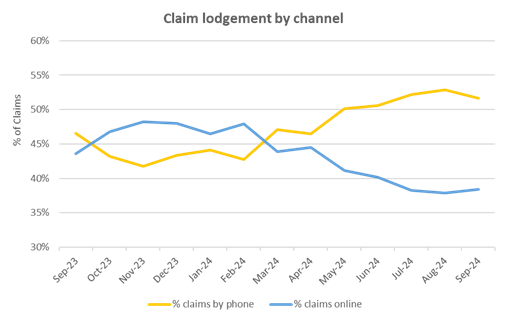
Looking at performance for any month, in isolation would give no indication of how things had changed or the trend. For example, looking at the data for Sept 23 and March 24 shows performance of both channels was the same. But the trends in each month were going in opposite directions! The actions and priorities could not be clear looking at any one month in isolation.
Performance curiosity also means digging for additional types of data that start to explain “top line” performance. The next level of data provides clues as to what needs to change. For example, in one major organisation, the performance of the contact centre channel couldn’t be understood without also being curious about things like:
· How the mix of interactions had changed
· Whether the staff mix had changed because batches of new hires increased handling time as soon as they hit the floor
· What marketing campaigns were active and to which customer groups
· What outcomes the staff were obtaining and how this was changing
· What external events e.g. global conflicts and weather events had changed the work mix.
Those who managed performance well, had data and insights on all these factors to make sense of the performance of that channel.
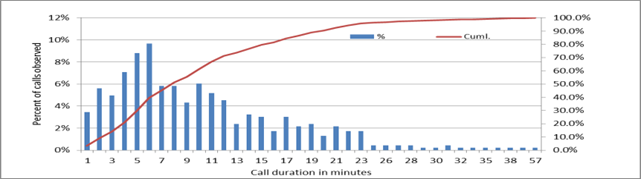
Performance curiosity also requires data technique like looking to “unpack” averages to understand variations. For example, the chart below unpacks the average duration of interactions into time slices. This view shows the long tail caused by a small number of very long contacts. The average hides that complexity. Understanding those calls and what drove the duration was the obvious next step in performance curiosity that would lead to actions that might change performance.
Often averages hide critical detail and can lead to management proposing the wrong performance solutions. For example, an Operations Manager analysed average work arrivals for a critical function for month in order to plan staffing levels. The analysis used a “heat map” summarising the average volume of work arriving by each half hour interval for the prior month. The manager used this to propose increased staffing to meet the peak intervals. However, by looking at the average for the whole month, the analysis missed two critical factors: Firstly, that the volume of work varied by day of week with Mondays and Tuesday’s far busier than the rest of the week. Secondly, the volumes were gradually reducing over the month (another hidden trend). Therefore, the design of solutions needed to understand the data at deeper levels than the monthly average. Better performance could be produced with a more sophisticated solution that recognised that staffing levels needed to be different for different days of the week and that even this might not be needed if the downward trend in demand continued.
Information for Observation
Data on performance is an essential starting point to improve performance. It helps to target where further performance curiosity needs to be applied. The next level of performance curiosity adds “observations” that explain why the performance is occurring. For example, in one organisation customers were not adopting the digital channel at the rate the company expected. The data showed the problem but not the solution. They initiated two levels of performance curious observations to get to the solution. Firstly, they re-initiated usability analysis (with customers) of the parts of the digital application where information told them that customers often gave up or stopped. This helped them understand and fix problems in the design that were barriers to use. Secondly, they sampled conversations in the contact centre to understand how and when the agents were promoting the digital solutions. These observations showed that front line staff rarely, if ever, promoted the digital solution and had no incentive to do so. These two sets of observations enabled the organisation to apply solutions that changed performance. They fixed the usability of the application and gave front line staff incentives and training on how and when to promote digital. This led to a step change in the channel performance.
Observation in different forms is critical to make sense of reported performance for individuals. For example, a Sales Manager in one business used data to understand that salesman A had really low sales results for Product X, the most expensive product in the line-up. He was able to set up a scenario where he could observe the salesman in action for those products. Those observations showed him that the salesman often referred customers to cheaper products rather than the more appropriate one (he “down-sold"). Other observations showed that the salesman couldn’t explain the features and benefits of this product or justify the premium price. Now the manager had three specific observations to address that could help change performance if he worked on them one at a time.
Understanding the best way informs the performance curious

Performance curious managers use their observations and compare these to what “good looks like” for any level of process. This makes observations of those doing the work effective because there is something to compare to. For example, a different performance curious sales manager turned around the conversion rate of her sales team by re-defining the sequence and substance of a sales interaction. Her observations showed her that her team didn’t gather needs well, and often tried to sell the wrong product. She worked on a better “definition” of the right way to do both those things. Giving the team a defined way to gather needs and then a matrix that made it easy to match needs to products, lifted the conversion rate of the team by nearly 30%.
In another scenario, a company had invested time in defining a whole series of improved practices that cut time from processes and delivered more certain outcomes. The most performance curious managers made sure they understood how the new process worked and coached their teams to follow this new way of working. These managers spent time observing each team member and picking up the differences between the old and new ways. They soon got results in their team as those who adhered to the new best way were both more productive and received better customer satisfaction scores.
In a major complaints business, a process curious manager realised that processes had never been challenged and were delivering poor outcomes. Information showed that complaint durations were getting longer and many escalated to complex complaints. The manager used an external organisation to help him observe the processes and find the flaws. The observations led to a new design of the way each stage of the process worked. New process steps were added to “contain and resolve the complaint”. Then the team were trained in this new process flow. The results were dramatic with the time to resolution falling by over 50% as every stage of the process produced greater resolution. The workload across the business shrunk by over 40% even though more time was being invested in certain process steps. The “re-definition” of good at each process stage transformed performance of the organisation as well as their reputation in the industry. All that stemmed from performance curiosity.
Summary
In this paper, we hope we have explained the value of being performance curious. There are some amazing tools and tricks available, and we are always happy to share these ideas in more detail. If you would like to discuss this further, please feel free to get in touch at info@limebridge.com.au or call 0438 652 396.


This is a simple and clear post. It is easy to understand for all readers. I also tried online slope city. It is an arcade-style game with endless slopes and obstacles. You need good timing to stay on track and move forward.
The article about curiosity and performance was very insightful. During psychology coursework, I relied on University Assignment Writing Service UK when connecting theory with examples became confusing. It helped me explain concepts better. The post shows how curiosity plays a strong role in personal and professional growth. It reminded me how passions and responsibilities often run side by side in life. your post makes me smile
This post is truly engaging and well put together. I appreciate the clarity and thoughtfulness behind your content, making it both informative and enjoyable to read. It’s always great to see posts that genuinely add value and spark interest among readers.
For those aiming to secure funding and bring their ideas to life, working with a professional Grant Writing Company can be highly beneficial. Expert Grant Writing Services ensure that proposals are well-structured, persuasive, and aligned with funder expectations. From identifying the right opportunities to crafting compelling narratives, a Grant Writing Company helps streamline the entire process. Many organizations struggle with technical details and time constraints, which is where Grant Writing Services provide essential support. By leveraging their expertise, applicants can…
We select girls based on your interests and inclinations so that you can get a companion of your choice and enjoy our Delhi Escorts Service to the fullest.